In the politics of education course I teach this semester, I was looking for a nice overview of trends in party control for Congress and state legislatures. Just a simple chart showing trends in which party holds the majority in the House and Senate and whether similar trends occur in state legislatures. We often just focus on one or the other, but I want to see Congress and states on the same graph.
But I couldn’t quite find what I was looking for. So in its absence (and in losing patience digging around), I compiled data from the Senate and House history pages along with the National Conference of State Legislatures partisan composition page.
A few notes about what’s being measured here. For the states, NCSL tells us whether both chambers are controlled by a given party. If Democrats hold both chambers, then the state is coded as “Democrat.” States are coded as “Split” if Democrats carry one chamber and Republicans the other. Nebraska is omitted because it has a non-partisan unicameral legislature, but I put them in the “Split plus NE” category just so we have all 50 states. And all data are as of January of the given year, except 2016, which uses December to reflect the outcomes of the most recent election:
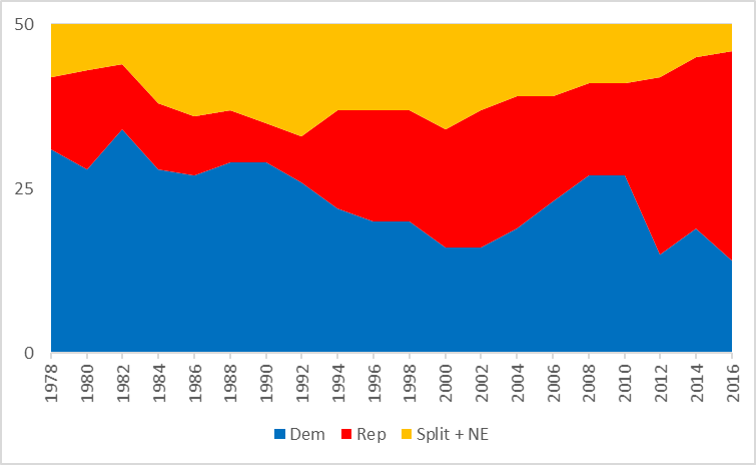
In this time frame, Democrats held party control in state legislatures until the early 1990s. At that time, states were becoming more split and slowly more Republican-controlled until Democrats gained a short-lived advantage around 2006. This results in an inverse portrait where 31 states were controlled by Democrats in 1978 and, fast-forwarding to the post-2016 election, 32 states are now controlled by Republicans.
Shifting gears to Congress, the chart shows the percentage of members from each of the two parties:
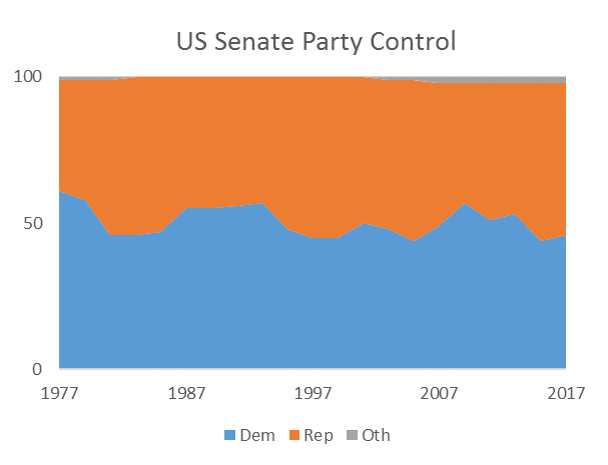
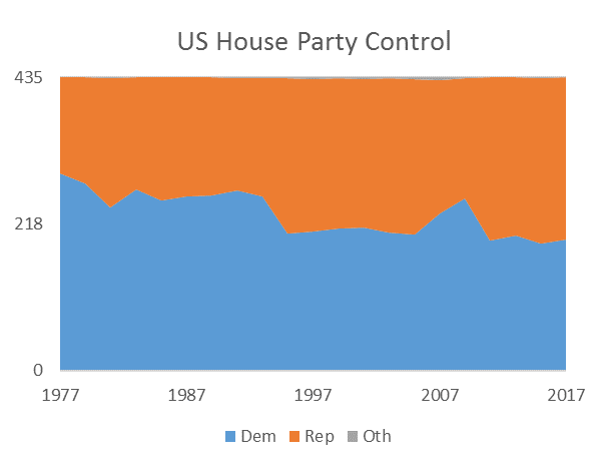
In the Senate during this period, Democrats went from a high of 58 of seats in 1978 down to 46 in the current (115th) Congress. In the House, we see similar trends where Democrats held 64% of seats in 1978 and this has slowly dropped to about 45% today (194 D to 241 R).
But these three charts are hard to put the full picture together, so the following combines them into a single visualization that I think tells the story a little clearer:
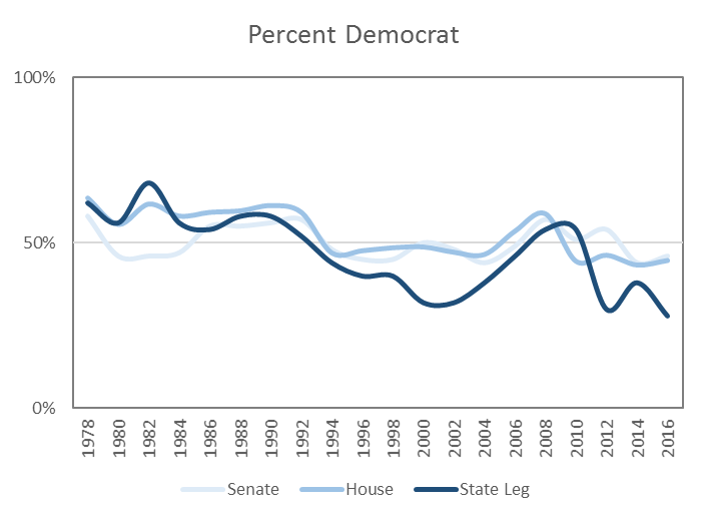
This chart shows three lines: the two light blue lines show the percent of Senate and House seats held by Democrats, the dark blue is the share of state with Democratic party control. Same goes for Republicans:
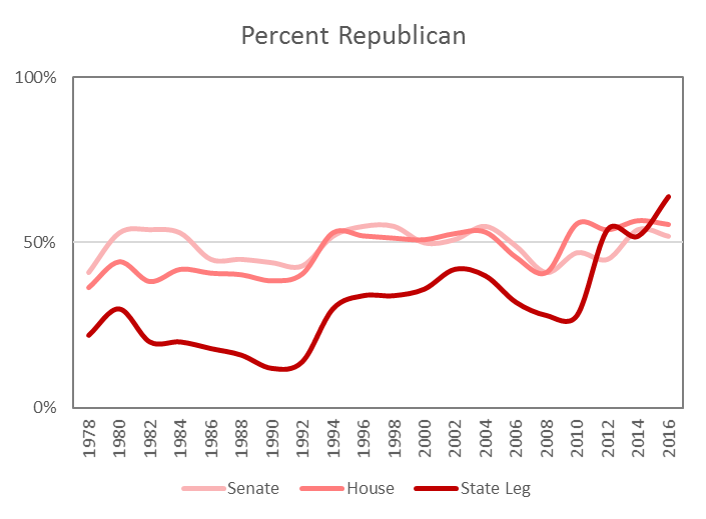
For a brief period in the early 1980s, Democrats held majorities in the House and Senate while also having party control of the majority of state legislatures. This is now the situation for Republicans, who have picked up state legislative party control and have gained majorities in Congress since 2010-2012.
These trends aren’t really surprising since we know Republicans have control of legislative chambers both in the states and in Congress. But how this has changed over time, the magnitude of growth, and overlaying these trends onto the same graph is something new to me. This helps me frame our class discussions around the broader political, social, demographic, and economic mechanisms driving these changes. I am no political scientist, so I can’t get too deep in the weeds, but this can help me frame some of our discussions around the broader partisan context in which higher education policy is being made.
Sources: Senate: https://www.senate.gov/history/partydiv.htm, House: http://history.house.gov/Institution/Party-Divisions/74-Present/, NCSL: http://www.ncsl.org/research/about-state-legislatures/partisan-composition.aspx
Data:
| Senate | House | State Legislatures | |||||||
| Dem | Rep | Oth | Dem | Rep | Oth | Dem | Rep | Split+NE | |
| 1978 | 58 | 41 | 1 | 277 | 158 | 0 | 31 | 11 | 8 |
| 1980 | 46 | 53 | 1 | 242 | 192 | 1 | 28 | 15 | 7 |
| 1982 | 46 | 54 | 0 | 269 | 166 | 0 | 34 | 10 | 6 |
| 1984 | 47 | 53 | 0 | 253 | 182 | 0 | 28 | 10 | 12 |
| 1986 | 55 | 45 | 0 | 258 | 177 | 0 | 27 | 9 | 14 |
| 1988 | 55 | 45 | 0 | 260 | 175 | 0 | 29 | 8 | 13 |
| 1990 | 56 | 44 | 0 | 267 | 167 | 1 | 29 | 6 | 15 |
| 1992 | 57 | 43 | 0 | 258 | 176 | 1 | 26 | 7 | 17 |
| 1994 | 48 | 52 | 0 | 204 | 230 | 1 | 22 | 15 | 13 |
| 1996 | 45 | 55 | 0 | 207 | 226 | 2 | 20 | 17 | 13 |
| 1998 | 45 | 55 | 0 | 211 | 223 | 1 | 20 | 17 | 13 |
| 2000 | 50 | 50 | 0 | 212 | 221 | 2 | 16 | 18 | 16 |
| 2002 | 48 | 51 | 1 | 205 | 229 | 1 | 16 | 21 | 13 |
| 2004 | 44 | 55 | 1 | 202 | 231 | 2 | 19 | 20 | 11 |
| 2006 | 49 | 49 | 2 | 233 | 198 | 4 | 23 | 16 | 11 |
| 2008 | 57 | 41 | 2 | 256 | 178 | 1 | 27 | 14 | 9 |
| 2010 | 51 | 47 | 2 | 193 | 242 | 0 | 27 | 14 | 9 |
| 2012 | 54 | 45 | 1 | 201 | 234 | 0 | 15 | 27 | 8 |
| 2014 | 44 | 54 | 2 | 188 | 246 | 1 | 19 | 26 | 5 |
| 2016 | 46 | 52 | 2 | 194 | 241 | 0 | 14 | 32 | 4 |