Governor Walker released his budget proposal yesterday, which includes about $138.5 million for the University of Wisconsin System (UWS) over the next two years.
This $138.5 is broken down into four main buckets:
- $50 million from a lapse (i.e., funds promised but never delivered last biennium)
- $42.5 million for a new performance-based funding program
- $35 million to reduce tuition sticker-price by 5%
- $11 million for employee compensation
There are several other items worth following, including opting out of allocable student fees, faculty workload monitoring, mandating internships, having 60% of academic programs offer 3-year bachelor’s degrees by 2020, and providing financial aid for Flex Option students.
But for now, let’s focus on these bullet points and situate this budget proposal in the broader context of historical General Purpose Revenue (GPR) funding for UWS.
A quick detour/primer on GPR: The state of Wisconsin generates most of its GPR via individual income and sales tax (85% of total GPR), but it also supplements with corporate tax (7%), excise tax (5%), and other sources of revenue (4%). When the legislature and governor finalize the budget, GPR funds are then appropriated to help UWS cover the costs of delivering higher education, namely by covering the salaries, wages, and benefits for faculty and staff while also subsidizing campus operations/maintenance and debt service expenses.
When the UWS was created in 1973, nearly 120,000 full-time equivalent students (FTE) enrolled across all campuses. Enrollments grew until the mid 1980s, flattened and dipped until the early 2000s when it steadily rose until after the Great Recession. Since 2010, enrollments have been slowly declining and the most recent data shows about 150,000 FTE are enrolled across the system. The dotted line is simply a flat line from the most recent enrollment level, as we should not expect much enrollment growth for the foreseeable future.
Figure 1: FTE enrollment in UWS
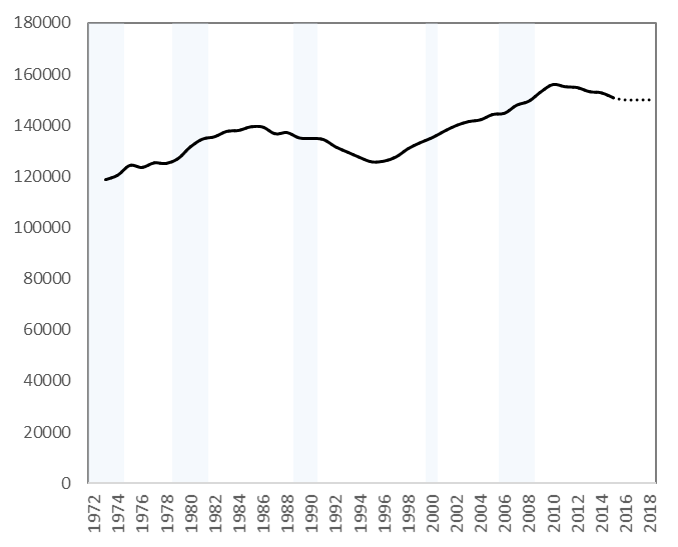
Source: UW System Accountability Dashboard
Despite this long-term enrollment growth, GPR revenue has steadily declined over time, shown in Figure 2.
Figure 2: GPR funding levels for UWS (2016 dollars, mil.)
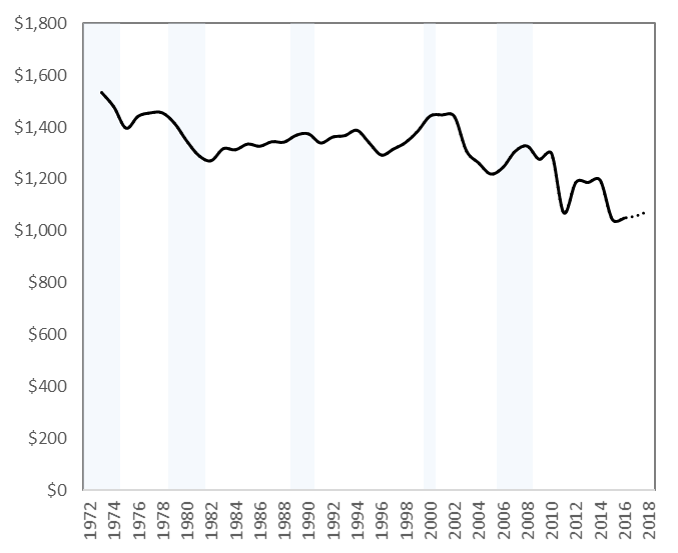
Source: Wisconsin Legislative Fiscal Bureau , LFB Informational Paper #32, and Governor’s budget.
The small dotted line at the end represents Governor Walker’s recent budget proposal, which would appropriate $1.057 billion and $1.076 billion in fiscal years 2017 and 2018, respectively. This budget proposal would bring Wisconsin back to 2010 levels and about $170 million behind pre-recession levels. About 32,000 more FTE students enroll in the UWS today compared to 1973, yet GPR funds are about $500 million lower than that year.
This means state investment is not keeping pace with enrollment growth, as shown in Figure 3. In the 1970s and 1980s, the state invested between $10,000 and $12,000 per FTE, but this changed around 2000 when per-FTE investment has steadily eroded.
Figure 3: GPR appropriations per FTE (2016 dollars)

Source: UW System Accountability Dashboard and LFB (see Figures 1 and 2 sources)
Unlike some other public services, colleges and universities are able to generate revenue via user-fees (tuition and fees). So, as state funding erodes, these user-fees have risen and students are now investing more in the UWS than the state of Wisconsin.
Below are two figures illustrating this point. Figure 4 shows all funds for the UWS, which sums to over $6 billion. State GPR covers about 17% of the total budget, whereas students cover about 25%. These funds (tuition and GPR) cover the core instructional costs for undergraduate education and it is what academic and non-academic units on campus use to deliver high-quality education. The other funds listed below are neither fungible nor targeted solely for undergraduate education: federal research grants, financial aid, and gifts/trust income are restricted for specific uses; auxiliaries are self-sustaining enterprises and cost recovery/operational receipts are project and program specific.
Tuition and GPR are the most important resources UWS campuses have available for ensuring classes are available, faculty and staff can deliver high quality services, and that students are well prepared for life after college. And research consistently shows state investment pays off by improving access, degree completion, shortening time-to-degree, so there is good evidence to support this investment. Tuition increases can discourage students from enrolling, but this can be counteracted by investing in student financial aid programs (particularly need-based aid).
Figure 4: UWS All-Fund Operating Budget (2016-17)
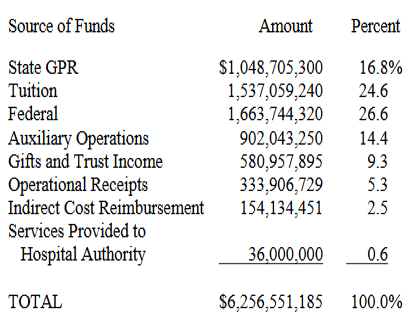
Source: Wisconsin Legislative Fiscal Bureau (2017). Informational Paper #32.
Figure 4 shows that student’s tuition revenue ($1.54 billion) now exceeds state investment ($1.05 billion). But when did this tipping point happen for the UWS? Have students always carried a larger share than the state? Due to data unavailability, the chart below only shows tuition and GPR from 2004 forward.
Figure 5: Total UWS revenue from tuition and GPR (2016 dollars, mil.)

Source: LFB Informational Paper #32, Table 11.
I am in the process of documenting years prior to 2004, but this shows clearly that the tipping point occurred in 2010, when students first began carrying a larger share of the UWS budget than Wisconsin. And this gap has grown over time, where students now pay about $1.50 for each $1.00 Wisconsin invests in the UWS.
The dotted lines in Figure 5 represent projections based on Governor Walker’s budget. It includes the $21.25 million of performance-based funding for 2017 and 2018, respectively. It also includes the $50 million funding lapse and the anticipated $11 million (for employee compensation) based on the Governor’s estimated cost savings from self-insurance. It also accounts for the 5% decrease in sticker-price tuition, which would occur in 2018.
It is hard to estimate what the $35 million (5% reduction) in tuition would look like in practice since sticker-price tuition is not a good proxy for net tuition revenue. A student could be charged a lower sticker price, yet still end up paying more tuition if financial aid does not fill unmet financial needs. To bring the evidence base to bear on this budget proposal, two recommendations emerge:
- The $35 million in tuition reductions would be better targeted to need-based financial aid (via HEAB’s Wisconsin Grant program) which has lost its purchasing power over the years. This type of aid has also been shown to increase degree completion, so it would be an effective and efficient way to target resources to the most price-sensitive students.
- The $92.5 million from the prior budget lapse and the new performance funding model would likely go further if it was targeted to capacity-constrained campuses that have been most affected by recent budgetary cuts. Making these colleges whole (or working to that end) would make more courses available for students while helping campuses provide high-quality academic and student support services to ensure timely (and more affordable) degree completion. Targeting resources into these “shovel-ready” projects will generate large private and social returns for the state of Wisconsin.
Data (see figures above for sources)
| Year | GPR (2016 $, mil) |
Tuition (2016 $, mil) |
FTE | GPR per FTE | Tuition per FTE |
| 1973 | 1533 | 118787 | 12908 | ||
| 1974 | 1478 | 120551 | 12261 | ||
| 1975 | 1396 | 124389 | 11221 | ||
| 1976 | 1442 | 123559 | 11673 | ||
| 1977 | 1455 | 125361 | 11608 | ||
| 1978 | 1455 | 125134 | 11628 | ||
| 1979 | 1414 | 127094 | 11126 | ||
| 1980 | 1346 | 131630 | 10226 | ||
| 1981 | 1290 | 134652 | 9578 | ||
| 1982 | 1270 | 135591 | 9369 | ||
| 1983 | 1317 | 137675 | 9564 | ||
| 1984 | 1312 | 138042 | 9508 | ||
| 1985 | 1335 | 139472 | 9569 | ||
| 1986 | 1326 | 139371 | 9516 | ||
| 1987 | 1344 | 136722 | 9829 | ||
| 1988 | 1342 | 137222 | 9780 | ||
| 1989 | 1369 | 135116 | 10129 | ||
| 1990 | 1374 | 134908 | 10187 | ||
| 1991 | 1339 | 134511 | 9953 | ||
| 1992 | 1362 | 131640 | 10346 | ||
| 1993 | 1367 | 129566 | 10553 | ||
| 1994 | 1388 | 127494 | 10885 | ||
| 1995 | 1339 | 125754 | 10649 | ||
| 1996 | 1292 | 126007 | 10254 | ||
| 1997 | 1316 | 127649 | 10306 | ||
| 1998 | 1341 | 130898 | 10243 | ||
| 1999 | 1385 | 133235 | 10394 | ||
| 2000 | 1443 | 135205 | 10670 | ||
| 2001 | 1447 | 137730 | 10507 | ||
| 2002 | 1442 | 140000 | 10299 | ||
| 2003 | 1308 | 141500 | 9245 | ||
| 2004 | 1262 | 1025 | 142209 | 8871 | 7211 |
| 2005 | 1219 | 1057 | 144298 | 8445 | 7326 |
| 2006 | 1244 | 1083 | 144814 | 8592 | 7477 |
| 2007 | 1306 | 1088 | 147956 | 8829 | 7351 |
| 2008 | 1327 | 1094 | 149493 | 8875 | 7317 |
| 2009 | 1275 | 1176 | 153193 | 8323 | 7678 |
| 2010 | 1298 | 1224 | 156039 | 8318 | 7842 |
| 2011 | 1069 | 1290 | 155163 | 6888 | 8315 |
| 2012 | 1187 | 1335 | 154843 | 7664 | 8624 |
| 2013 | 1186 | 1359 | 153252 | 7741 | 8867 |
| 2014 | 1195 | 1368 | 152773 | 7820 | 8954 |
| 2015 | 1043 | 1410 | 150832 | 6914 | 9348 |
| 2016 | 1049 | 1430 | 150000 | 6991 | |
| 2017 (est) | 1057 | 1430 | 150000 | 7046 | |
| 2018 (est) | 1076 | 1395 | 150000 | 7170 |