Last week, two state lawmakers proposed a new merit-based financial aid program designed to help keep the “best and brightest” Wisconsin students in-state for college. This got me intrigued about the extent of out-of-state migration occurring among recent WI high school graduates: how many students go out of state in the first place? And where do they go?
To answer the second question first, below is a map showing where recent Wisconsin high school graduates began college:
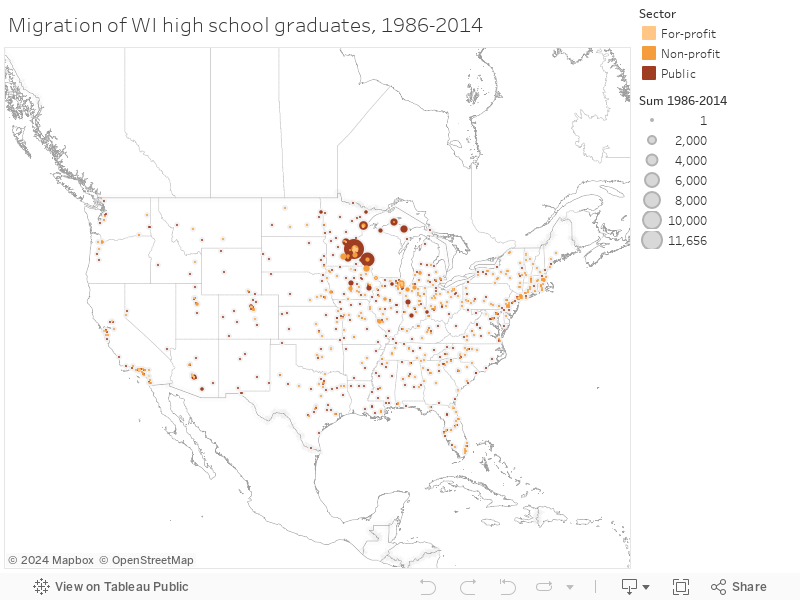
In answering the first question, here are the out-migration patterns of recent Wisconsin high school graduates since 1986 (Figure 1). During the 1980s and 1990s, the number of WI residents attending college out-of-state steadily rose. After its peak in the early 2000s, the number has steadily fallen over the past decade. In 2014, approximately 7,600 WI high school graduates went out of state for college.
Figure 1:
Number of WI recent high school graduates enrolling outside Wisconsin

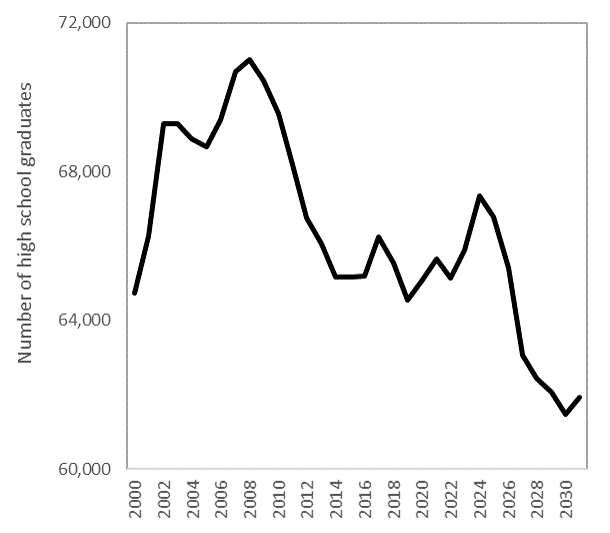
The steady drop in out-of-state enrollment coincides with the statewide trend of fewer high school graduates (Figure 2). With fewer students graduating from high school, there are fewer attending out-of-state and we should not expect this trend to reverse any time soon. This chart uses WICHE projections of high school graduates in the state, which is expected to plateau and then decline over the next decade.
Figure 2:
Total number of high school graduates in Wisconsin
With fewer graduates – and fewer leaving Wisconsin – it is the proportion of students leaving that gives a clearer view of out-migration. Figure 3 shows the percentage of recent high school graduates from Wisconsin who enroll in other states. After steady growth in the 1980s, this trend stabilizes in the mid-1990s and has hovered around 17 to 19 percent since then.
Figure 3:
Percentage of recent high school graduates attending out of state

With about 1 in 5 recent high school graduates leaving the state, this puts Wisconsin right at the national average in terms of out-migration. Figure 4 uses Digest of Education Statistics data to show how Wisconsin fares compared to other states. On one extreme is Vermont, where more than half of their recent high school graduates attend out of state. On the other extreme is Mississippi, where fewer than 1 in 10 leave for college. Wisconsin’s out-migration rate is higher than Michigan and Iowa, but far lower than Illinois and Minnesota.
Figure 4:
Percent of recent high school graduates enrolling out-of-state

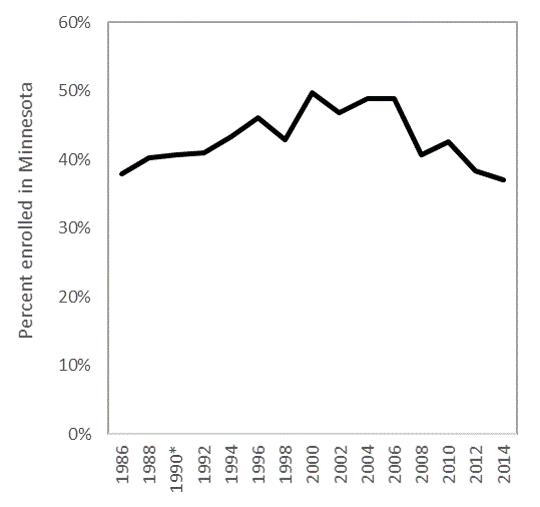
Since Wisconsin and Minnesota have a tuition reciprocity agreement, the next figure shows the share of Wisconsin out-migrants who attended a college in Minnesota. Not all of out-migrants participate in a tuition reciprocity agreement, so this chart should not be interpreted in that light; rather, this simply shows the proportion of Wisconsin residents who attended any Minnesota institution. In the early 2000s, the majority of Wisconsin leavers went to Minnesota, but this is no longer the case.
Figure 5:
Share of Wisconsin high school graduates enrolled in Minnesota colleges
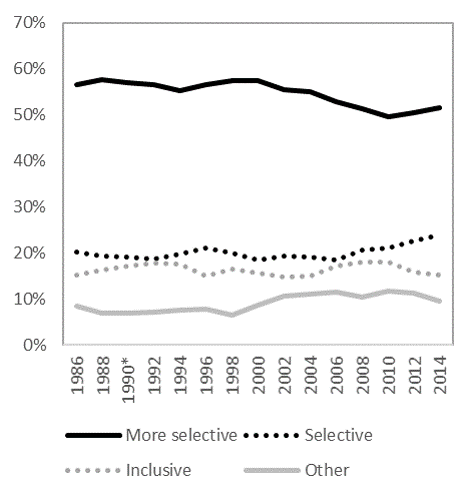
When Wisconsin high schoolers go out of state for college, they often attend “more selective” four-year universities. For reference, three UW System universities are classified in this category: Madison, Eau Claire, and La Crosse. However, Figure 6 uses the Carnegie Classification to show this is not always the case, as many leavers attend less selective institutions. This trend requires greater attention, but may indicate that students leave the state for other reasons than attending highly-selective universities.
Figure 6:
Percent of recent high school graduates who left Wisconsin, by selectivity band
The purpose of this post is to help contextualize and bring data to bear on recent discussions regarding student migration patterns. These back of the envelope estimates use IPEDS data that include only first-time degree-seeking students who graduated high school within the past 12-months and enrolled in college. It is possible other patterns emerge using different datasets, for Wisconsin residents who are not recent high school graduates, or for those who are not first-time students. Much more research is needed to track the extent of out-migration, but the sketches provided here aim to help explain the extent of out-migration among recent high school graduates and to identify where out-migrants enroll. Knowing this may help diagnose the severity of the “brain drain” problem while also helping campus leaders develop efficient and effective strategies for growing the stock of human capital in the state.
Data:
| Total | Stayed in Wisconsin | Left Wisconsin | |||||
| Subtotal | Public 4yr | Non-profit 4yr | Subtotal | Public 4yr | Non-profit 4yr | ||
| 1986 | 31,277 | 28,058 | 19,069 | 2,508 | 3,219 | 1,356 | 1,632 |
| 1988 | 33,774 | 29,268 | 18,753 | 3,265 | 4,506 | 2,006 | 2,229 |
| 1990* | 33,269 | 28,525 | 17,037 | 3,529 | 4,744 | 2,071 | 2,365 |
| 1992 | 32,763 | 27,782 | 15,321 | 3,793 | 4,981 | 2,136 | 2,500 |
| 1994 | 31,771 | 26,585 | 15,638 | 3,367 | 5,186 | 2,367 | 2,438 |
| 1996 | 33,151 | 27,371 | 17,330 | 3,333 | 5,780 | 2,599 | 2,739 |
| 1998 | 34,621 | 28,592 | 18,802 | 3,662 | 6,029 | 2,788 | 2,836 |
| 2000 | 36,661 | 29,946 | 17,969 | 3,851 | 6,715 | 3,213 | 2,909 |
| 2002 | 38,148 | 31,135 | 19,046 | 3,733 | 7,013 | 3,526 | 2,682 |
| 2004 | 39,420 | 32,040 | 19,370 | 4,078 | 7,380 | 3,875 | 2,622 |
| 2006 | 42,270 | 34,212 | 21,029 | 4,528 | 8,058 | 3,851 | 3,173 |
| 2008 | 41,749 | 33,812 | 20,546 | 4,620 | 7,937 | 3,721 | 3,259 |
| 2010 | 42,424 | 34,366 | 20,820 | 4,682 | 8,058 | 3,661 | 3,352 |
| 2012 | 41,945 | 34,220 | 21,117 | 4,337 | 7,725 | 3,565 | 3,262 |
| 2014 | 40,489 | 32,812 | 20,502 | 4,271 | 7,677 | 3,598 | 3,340 |
* 1990 is estimated by taking the mean of the prior and following years; data are not reported this year.