D3 Basics
Web Developer Tools
Debugging & Developer Tools
In order to debug your D3 code, it will be necessary that you're a little familiar with the debugging tools available in your web browser. Accessing the JavaScript console will be necessary for finding bugs in your code.
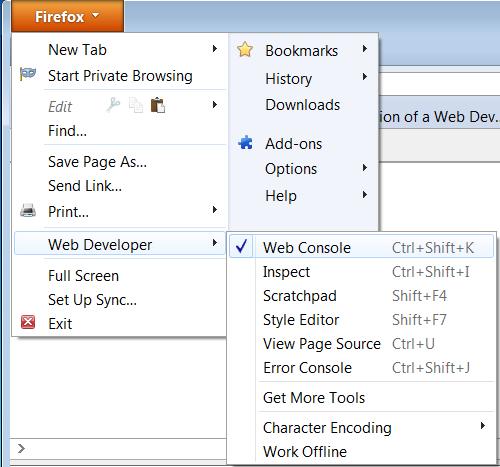
Developer Tools in Firefox
Within Firefox, the Developer tools can be found under the Web Developer menu.
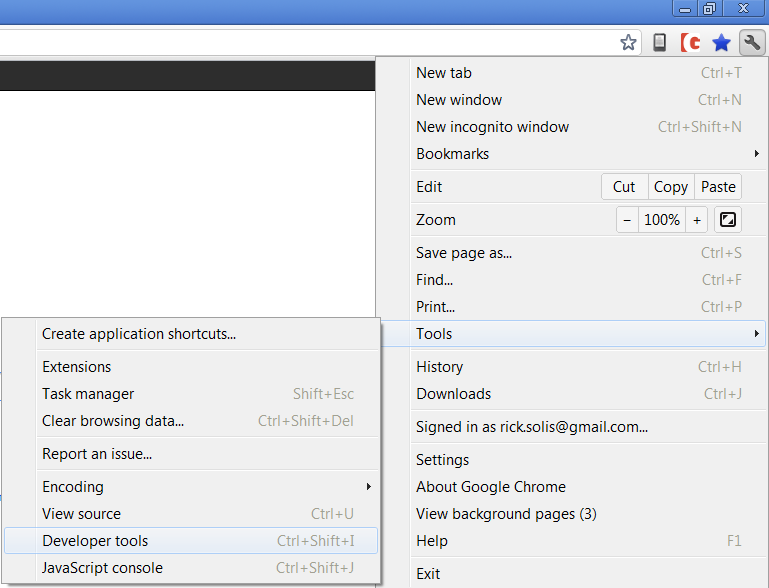
Developer Tools in Chrome
In Chrome, the developer tools can be found under Wrench -> Tools
When you're debugging, looking at the JavaScript conole is useful for finding syntax problems. Most time the error console will give you a line number as to where the problem started in your script.
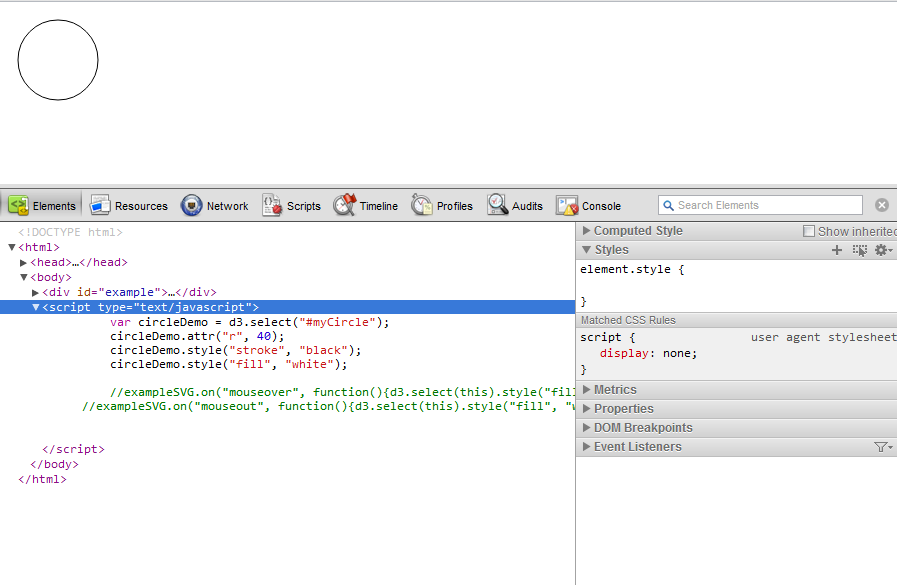
Using the inspector is helpful for finding problem in DOM. You can inspect specific elements on the page. When you inspect a DOM element the develop tool will show you the relevant code in the text window.
It's not necessary for beginners to be knowledagble on all the different features available in the developer tools. Being able to inspect elements and reading the JavaScript error console is a good start.

Selections
Selections are very important for coding in d3 as you cannot do much without them. Before you can change or modify any elements in d3 you must first select them. This can be done using either d3.select(this) or d3.selectAll(this) where “this” is the specific element(s) you are trying to select. .select() will just select the first element that matches to the criteria specified, if you are selecting one of several objects that have this criteria then be sure to remember that this will select the first one in document traversal order. .selectAll() will simply select all the elements that match the criteria specified and return them as an array of elements. You can select elements in the following ways:
Tag
d3.select(“div”)
Class
d3.select(“.classname”)
Unique identifier
d3.select(“#line”)
Attribute
d3.select(“[color=black]”)
Containment
d3.select(“parent child”)
Selectors can also utalize AND and OR operators as well. To make a selection of the intersection of two selectors simply place them side by side, while for the union you just put a comma in between them as illustrated below:
AND:
d3.select(“this that”)
OR:
d3.select(“this, that”)
It is also possible to use Subselections to restrict your selections to the descendants of other elements. For example, say you want to select the very first bold element in every paragraph, you would use the following code:
d3.selectAll(“p”).select(“b”)
After you have an element selected you can then call any number of operators on them to change them, such as attributes and styles, and then use the method chaining syntax of jQuery. jQuery attributes
Attributes/Styles
Changing Attributes and Styles
D3 provides methods for changing attributes and styles of elements. We'll look at the basics of .attr() and .style() so you can begin using these to adjust SVG attributes and styles.
While .attr() and .style() can be used to style non-SVG elements, for the purposes of this tutorial, we'll only be using these methods in the context of SVG.
In order to use .attr() and .style() they have to called on a selection.
In the code below, we use D3 methods to select a circle element, change its radius and color.
<!DOCTYPE html>
  <html>
    <head>
      <script type="text/javascript" src="http://mbostock.github.com/d3/d3.js"></script>
    </head>
    <body>
      <div id="example">
        <svg width="100" height="100">
          <circle id = "myCircle" cx="50" cy="50" r="30" ></circle>
        </svg>
      </div>
      <script type="text/javascript">
        var circleDemo = d3.select("#myCircle");
          circleDemo.attr("r", 40);
          circleDemo.style("stroke", "black");
          circleDemo.style("fill", "orange");
      </script>
    </body>
  </html>
Because CSS styling isn't specified, the circle would be filled black, if we didn't change the styles.
<circle id = "myCircle" cx="50" cy="50" r="30" ></circle>
To begin modifying the circle, we first need to create a selection. We'll select myCircle and assign it to a D3 variable called circleDemo.
circleDemo contains our selection pointing to the SVG circle element myCircle within the DOM.
var circleDemo = d3.select("#myCircle");
Now that we have the circle element assigned to a D3 variable, we can begin change the attributes and styles.
.attr() Method
.attr() is used to change an element's attributes. Attributes that are used to initially define an element can be passed through .attr() This lets you modify existing elements and set new attribute values. Attributes such as an SVG element's size or position can be changed with .attr()
.attr() requires it be given two values: The attribute to be changed, and the new value for the specified attribute.
In order to use .attr() is must called on a selection.
selection.attr("attribute string", new value)
To change the circle's size, we'll call the .attr() method on our circleDemo selection.
We call .attr() and pass the attribute we want to change ("r") with its new value (40).
circleDemo.attr("r", 40);
Now when the circle is drawn in the browser, the radius is set to 40.
NOTE: It's important to keep in mind that D3 has not created a new element. Instead, D3 is modifying the existing circle.
.style() Method
.style() changes the CSS styling of the selected element. You can change how an element looks as long as it can be specified through CSS. This allows for styling changes to exist outside D3. As CSS changes and evolves, D3 can utilize these new changes without the need of a patch.
.style() requires it passed two values -- the CSS style that's going to be modified and the new value.
.style() requires that it be called on a selection.
selection.style("CSS Style string", new value)
Here we have changed two CSS styles --The color of the stroke (line used to draw the element) and the fill color.
  circleDemo.style("stroke", "black");
  circleDemo.style("fill", "white");
NOTE: The CSS changes D3 makes are done directly to the document. The changes are not being done to the circleDemo variable. Instead circleDemo is a pointer to the circle element in the document which is being changed.
Recap of .attr() and .style()
While these simple examples only demonstrate the most basic usage of .attr() and .style(), more functionally can be gained by combining these methods with data-binding and mouse events. In the later examples, we'll explore how these two methods can be used in combination with data.
As a review, copy the code at the very top of the page and try changing different attributes and styles for the circle element.
Note: Outside of D3, attribute and styling terminology can be confusing. For example, what D3 calls styles, the SVG standard calls presentation attributes.
Data Binding, append, enter()
Binding Data with .data()
Normally when you you store a value in programming languages, it's done by assigning a value to a variable.
In JavaScript if we wanted to store values (1, 2, 3, and 4) in an array we would intialize a variable and assign the values as follows:
var myArray = [1, 2, 3, 4];
D3 does not store data within variables. Instead, D3 stores data within the DOM selectors by calling the selection.data() method.
In order to use the .data() method, it has to be called from a selector, and passed an array of values.
selection.data([array])
When .data() is called it joins the array of values with the array of selections that called it.
NOTE: A selection will always be an array of document elements. This is true for both select() and selectAll().
If we wanted to assign the values (10, 15, 20, 25) to selection containing 4 circle elements, in D3 this would be done by calling .data() on the selection circleSelections and passing the array [10, 15, 20, 25] .
myCircle.data([10, 15, 20, 25])
when .data() executes it takes the array [10, 15, 20, 25] and joins it with the selection array circleSelections.
                data[    5      ,      10      ,      15      ,      20    ]
                         |              |              |              |
                         |              |              |              |
                         |              |              |              |
                         v              v              v              v
  circleSelections [  <circle>,     <circle>,      <circle>,       <circle> ]
.data() takes the first value in the array and joins it with the first selection from circleSelections.
NOTE: When .data() is called it iterates over the array and passes each value down the method chain.
5 gets joined with the first <circle> and stored within the DOM.
5 is then passed down the method chain, until the chain completes.
10 is joined with the second <circle> and stored within the DOM
10 is then passed down the method chain, until the chain completes.
... and so on
A Data Binding Example
Since .data() returns the values from the array it's been passed, we can use these values to change attributes and styles for SVG elements with a method chain.
NOTE: It's possible to use .data() for changing other elements, but we'll focus on SVG.
If we had 5 circle elements
created from the following code:
  <div id="data_example1">
    <svg width="375" height="100">
      <circle id = "myCircle" cx="30" cy="50" r="30" ></circle>
      <circle id = "myCircle" cx="100" cy="50" r="30" ></circle>
      <circle id = "myCircle" cx="170" cy="50" r="30" ></circle>
      <circle id = "myCircle" cx="240" cy="50" r="30" ></circle>
      <circle id = "myCircle" cx="310" cy="50" r="30" ></circle>
    </svg>
  </div>
D3 can change the radius by using values from from an array radiusData.
radiusData = [10, 15, 20, 25, 30];
.data() will join the data to the selection
.attr() will take the joined data, and be used to change the radius.
<!DOCTYPE html>
  <html>
    <head>
    <script type="text/javascript" src="http://mbostock.github.com/d3/d3.js">
    </script>
    </head>
    <body>
      <div id="data_example1">
        <svg width="375" height="100">
          <circle id = "myCircle" cx="30" cy="50" r="30" ></circle>
          <circle id = "myCircle" cx="100" cy="50" r="30" ></circle>
          <circle id = "myCircle" cx="170" cy="50" r="30" ></circle>
          <circle id = "myCircle" cx="240" cy="50" r="30" ></circle>
          <circle id = "myCircle" cx="310" cy="50" r="30" ></circle>
        </svg>
      </div>
      <script type="text/javascript">
      //radiusData is an array containing the new radius
      //for the circle elements
        radiusData = [10, 15, 20, 25, 30];

      //Select the div element
        selectExample = d3.select("#data_example1");

      //We'll select all the circle from within the selected <div> element
        selectExample.selectAll("circle")
          .data(radiusData)
          .attr("r", function(d){return d});
      </script>
    </body>
  </html>
Initially we select the <div> element containing all the circle elements.
selectExample = d3.select("#data_example1");
We can then select all the circle elements within selectExample.
This will return an array of circle element selections.
selectExample.selectAll("circle")
When we call .data() it will join the values from radiusData with the circle elements.
As .data() iterates across the array of circle selections, it returns the current radiusData value.
.data(radiusData)
By calling .data() in a method chain, D3 iterates over the data array (radiusData) and returns the present value to methods down the chain. This allows us to use values in radiusData with other methods, like .attr().
This functionality can be used to change radius using values from from the array radiusData.
This results in .attr() being called 5x. One for each value within the radiusData array.
Each time .attr() is called, it will receive a different value from radiusData.
In our example, a each value from radiusData called d is being passed down the chain.
NOTE: The value being returned from .data() and passed down the chain could have been given any non-conflicting name.
Now that .attr() is being passed a value, we can set the attribute we want to change ("r") and pass the new value through an anonymous function.
.attr("r", function(d){return d});
The resulting circles look like
Joining Multiple Values with .data()
.data() can be used to join multiple values to a single selection.
It's possible to pass an array of array to .data()
The array of arrays can contain multidimensional information that can be applied to each selection.
In this example circleData contains the radius and color for each circle element.
circle[0] contains the array [10, "rgb(246, 239, 247)"]
  circleData = [[10, "rgb(246, 239, 247)"], [15, "rgb(189,201,225)"],
  [20, "rgb(103,169,207)"], [25, "rgb(28,144,153)"], [30, "rgb(1,108,89)"]];
When selection.data(circleData) is called, it will return an array of values ["radius", "color"] for each selection.
In order to change colors and radius we chain .attr() method calls and index the array that's returned by .data().
  selectExample.selectAll("circle")
    .data(circleData)
    .attr("r", function(d){return d[0]})
    .style("fill", function(d){return d[1]});
We use an anonymous function and pass .attr() the array d. To set the radius value, we use an anonymous function which returns the first element (d[0]) in the array.
To set the style we use the similar code, but instead access the second element of d.
for the first circle selection, the equivalent code would look like
  .attr("r", 10)
  .style("fill", "rgb(246, 239, 247)");
The final code follows:
<!DOCTYPE html>
  <html>
    <head>
	  <script type="text/javascript" src="http://mbostock.github.com/d3/d3.js" >
      </script>
	</head>
    <body>
      <div id="data_example2">
      <svg width="375" height="100">
        <circle id = "myCircle" cx="30" cy="50" r="30" ></circle>
        <circle id = "myCircle" cx="100" cy="50" r="30" ></circle>
        <circle id = "myCircle" cx="170" cy="50" r="30" ></circle>
        <circle id = "myCircle" cx="240" cy="50" r="30" ></circle>
        <circle id = "myCircle" cx="310" cy="50" r="30"  ></circle>
      </svg>
      </div>
      <script type="text/javascript">

	  //radiusData is an array containing the new radius for the circle elements
      circleData = [[10, "rgb(246, 239, 247)"], [15, "rgb(189,201,225)"],

      [20, "rgb(103,169,207)"], [25, "rgb(28,144,153)"], [30, "rgb(1,108,89)"]];

      //Select the div element
      selectExample = d3.select("#data_example2");

      //We'll select all the circle from within the selected <div> element
      selectExample.selectAll("circle")
        .data(circleData)
        .attr("r", function(d){return d[0]})
        .style("fill", function(d){return d[1]});
      </script>
    </body>
  </html>
The code above results in these circles.
.enter() and .append()
In the previous example we hard coded the circle elements. While this was useful for explaining D3, it's not amendable to making changings to the code. If we wanted to change the circles to a different svg element, it would have to be done line by line.
We can improve the code by using D3 generate and append elements into the DOM. By doing this, changes can be made by editing a few lines of code.
In this example, we'll use .enter() and .append() to manipulate the DOM and add circle elements.
NOTE: .append() can be used to add any valid selection, tag, container or element into the DOM. It can be used to add <p>, <div>, text, <svg> elements, etc. But we'll focus on using .append() to add SVG elements.
NOTE: .enter() can only be used after a .data() method call. .
enter() is used to indicate that new elements will be added to the current selection.
An .append() or .insert() follows an .enter() call.
The condensed version of the previous examples looks like this:
<!DOCTYPE html>
  <html>
    <head>
     <script type="text/javascript" src="http://mbostock.github.com/d3/d3.js" >
     </script>
    </head>
    <body>
     <div id="data_example3"></div>
     <script type="text/javascript">
     circleData = [[10, "rgb(246, 239, 247)"], [15, "rgb(189,201,225)"],
      [20, "rgb(103,169,207)"], [25, "rgb(28,144,153)"],
      [30, "rgb(1,108,89)"]];

     var selectDiv = d3.select("#data_example3")
      .append("svg:svg")
      .attr("width", circleData.length * 100)
      .attr("height", 100);

     selectDiv.selectAll("circle")
      .data(circleData)
      .enter()
      .append("circle")
      .attr("cx", function(d){return d[0]*14})
      .attr("cy", 50)
      .attr("r", function(d){return d[0]})
      .style("fill", function(d){return d[1]});

     </script>
    </body>
  </html>
d3.select returns the <div id="data_example3"> selection and passes it the next method in the chain.
var selectDiv = d3.select("#data_example3")
.append() takes the <div id="data_example3"> selection and adds a svg container.
NOTE: When .append() adds items, the added item is a child of the current selection.
After adding the svg:svg container .append() completes by returning the current selection.
The current selection will always be the element that was added.
.append() returns the <svg> container as the selection.
.append("svg:svg")
The width is specified for the current selection (svg container).
.attr("width", circleData.length * 100)
The height is set.
When the method chain ends, selectDiv points to the <svg> container selection inside the <div> element.
.attr("height", 100);
At this point in the code, selectDiv points to the <svg> container.
Calling .selectAll.("circle") selects all the circle elements inside the <svg> selection.
Because <svg> does not contain any circle elements, .selectAll.("circle") returns an empty array.
selectDiv.selectAll("circle")
Now when .data(circleData) is called, its binding data to an empty selection array.
.data(circleData)
To append elements, we first must call .enter()
NOTE: .enter() can only be called after on a data selection
.enter() takes the selection returned by .data() and prepares it for adding elements.
Elements can be added using .append() and .insert().
.enter()
.append() adds a child circle element below the <svg> parent node.
NOTE: After after the circle is added .append() returns the circle element as the current selection.
.append("circle")
Now that a circle element exists, we can use the data array returned by .data(circleData) and use it to set attributes and styles for the current circle.
  .attr("cx", function(d){return d[0]*14})
  .attr("cy", 50)
  .attr("r", function(d){return d[0]})
  .style("fill", function(d){return d[1]});
This condense condensed code gives the same results.
Recap of .enter() and .append()
.enter() must follow a .data() method call.
.enter() uses the current selection as the parent node for the elements added with .append().
.append() can be used to add more than svg elements.
Mouse Events
D3 uses the syntax selection.on(type[,listener]) to add or remove event listeners for interaction. The type is an event type name like "click", "mouseover", or "submit". The listener is triggered by the mouse event to do something about the current DOM element. For example:
  .on("mouseover", function(){d3.select(this).style("fill", "green");})
  .on("mouseout", function(){d3.select(this).style("fill", "white");});
The example uses anonymouse functions to modify elements from an existing DOM. The styles are altered according to a function. So this code snippet "listens" to the mouse event and do changes accordingly.
  <div id="mouseEvent_example"></div>
    <script type="text/javascript">
      var sampleSVG = d3.select("#mouseEvent_example")
        .append("svg:svg")
        .attr("width", 200)
        .attr("height", 200);

      sampleSVG.append("svg:rect")
        .style("stroke", "gray")
        .style("fill", "white")
        .attr("x", 50)
        .attr("y", 50)
        .attr("width", 100)
        .attr("height", 100)
        .on("mouseover", function(){d3.select(this).style("fill", "green");})
        .on("mouseout", function(){d3.select(this).style("fill", "white");});
    </script>
The above is the source code of the example. Let's see another example on mouse events:
This time if you click on the square, it will be randomly assigned a rainbow color. We can do that by assigning an array of colors to the pool with these 2 lines of code:
  var source = ["red", "orange", "yellow", "green", "blue", "indigo", "violet"];
  var color = source[Math.floor(Math.random()*source.length)];
Note: On mouseout, the square is refilled with the default white color. If you click on the square again, it could be filled with another rainbow color because of the following code:
  .on("click", function(){d3.select(this).style("fill", function()
    {return source[Math.floor(Math.random()*source.length)];});})
  .on("mouseout", function(){d3.select(this).style("fill", "white");});
Buttons
Buttons are useful for building visulizations. The <button> is an HTML tag. It's not exclusive to D3.
By combining buttons and mouse events, D3 can provide interactivity.
In this example, we'll use the HTML button tag to execute D3 code that changes the attributes of 2 circles.
<!DOCTYPE html>
  <html>
    <head>
      <script type="text/javascript" src="http://mbostock.github.com/d3/d3.js"></script>
      <style = type='text/css'>
        .buttonex button {
          left: 220px;
          position: absolute;
          top: 320px;
          width: 80px;
        }
      </style>
    </head>
    <body>
      <div class = "buttonex" id="example99">
        <button>Randomize</button>
      </div>

      <script type="text/javascript">
      //data = [[radius, cx, cy, color]]
        data = [[10, 20, 20, "rgb(224, 236, 244)"],
	    [30, 50, 50, "rgb(136, 86, 167)"]]

        var w = 300, h = 300;
        var myExample = d3.select("#example99")
          .append("svg:svg")
          .attr("width", w)
          .attr("height", h)

        myExample.selectAll("circle")
          .data(data)
          .enter()
          .append("circle")
          .attr("r", function(d){return d[0]})
          .attr("cx", function(d){return d[1]})
          .attr("cy", function(d){return d[2]})
          .style("stroke", "black")
          .style("fill", function(d){return d[3]});

        d3.select("#example99 button").on("click", function() {
          myExample.selectAll("circle")
            .attr("cx", function(){return Math.random() * w})
            .attr("cy", function(){return Math.random() * h});

      </script>
    </body>
  </html>
We start by setting the position of the button using CSS styles and class.
  <style = type='text/css'>
  .buttonex button {
    left: 220px;
    position: absolute;
    top: 320px;
    width: 80px;
    }
Creating a button is simple. Here we've created a button with the text Randomize. The button in this example is created inside a <div> element.
<button>Randomize</button>
Using what we've learned from selections and mouse events, we can define an anonymous function that executes when the button is clicked.
The anonymous function will change the cx and cy positions to random values.
  d3.select("#example99 button")
      .on("click", function() {
        myExample.selectAll("circle")
          .attr("cx", function(){return Math.random() * w})
          .attr("cy", function(){return Math.random() * h});
      });
We start by selecting the button from the div element.
d3.select("#example99 button)
Next we define the on-click mouse event for the selection (which is the button).
We'll define an anonymous function that executes when the button is clicked.
.on("click", function() {
When the Randomize is clicked, the anonymous function selects all the circles and changes the cx and cy attributes to random values.
  function() {myExample.selectAll("circle")
    .attr("cx", function(){return Math.random() * w})
    .attr("cy", function(){return Math.random() * h});
	}
The final result looks like
Transitions
A transition is used on a selection to allow it's operators to apply smoothly over time, this allows for an eye pleasing effect when updating visual elements on the display. All that is needed to add a transition to your selection is simply to add the “transition()” operator to your selection as demonstrated below:
d3.select(“this”).transition()
Many of the operators supported for selection are also supported for transitions, such as attributes and styles, however there are some that are not supported, such as append.
Delay and Duration
By default the transition will start immediately and will last for a duration of 250ms, this can be changed using the .delay() and .duration() operators. These can be called with a specified constant in milliseconds such as .delay(3000) for 3 seconds, or they can be called with a function that will evaluate for each element in the current selection. These functions are called with 2 parameters, d for the current datum and i for the current index. So in the below example say our selection contains 2 elements, then the first element will transition after a delay of 1s while the second element will transition after a delay of 2 seconds, remember that index i starts at 0 for the first element.
  d3.select(“this”)
    .transition()
    .delay(function (d,i) { return 1000*(i + 1);})
    .attr(“stroke”, “blue”)
Ease
As you can imagine there is more than one way to make a smooth transition when changing an element, and that's where the .ease() operator comes in. By default a transition will use a cubic easing function, so the change will occur on a cubic scale. There are several other types including linear (changes at a linear pace) and bounce (simulates a bouncy collision). For a complete list of available ease functions see here. Below is an example of using the bounce ease function. Just click anywhere on the graph to see it in action.
  d3.select(“this)
    .transition()
    .ease(“bounce”)
Note: Click on the graph above to see the transition.